

2026 Innovation Assessment Research
Why innovation fails.
The decision that dooms a product is almost never made during development. It happens months earlier, in choices about which market to enter, whose problems to solve, and which opportunities are worth pursuing.
Based on 393 validated responses to the Strategyn Innovation Assessment — 35% from C-suite and senior executive leaders across industries.
THE PROBLEM
Innovation has a
5–20% success rate.
The tools have changed. The rate hasn’t.
That persistence is telling. If the problem were execution, execution improvements would have moved the needle. They haven’t. The reason is that improvement efforts target how work gets done, not whether the right work is being done in the first place. Organizations invest heavily in delivery while the root cause of underperformance sits earlier in the process.
Teams move quickly on the wrong problems, pursuing opportunities that were never properly qualified. They build solutions for customer needs that were never precisely defined. When initiatives fail, execution gets the blame. But execution rarely creates the problem. It inherits it.
Understanding why innovation fails starts with looking upstream. The decisions that determine whether an innovation effort succeeds are made before development begins. That is what the data from 393 innovation leaders makes clear.
What 393 innovation leaders revealed

The findings draw on 393 validated responses, screened from 599 collected across three quality criteria: completion time, internal consistency, and respondent tenure. Thirty-five percent of respondents were C-suite or senior executive leaders. Strategy and Innovation functions represented the largest group (41%), followed by Product (19%) and Marketing (9%).
Four findings at a glanceBased on the Strategyn Innovation Assessment, n=393
Finding 1
The front end of the innovation process breaks first.
Finding 2
Market selection is the highest-leverage, most underserved decision.
Finding 3
Customer needs are misunderstood at a fundamental level.
Finding 4
Most segmentation strategies produce phantom targets.
Where the Innovation Process Falls Short The three areas innovation leaders are least satisfied
Figure 1. Importance vs. satisfaction across Findings 2, 3, and 4. Source: Strategyn Innovation Assessment, n=393.
Finding 01
Top Challenge
Front-end decisions occupy the highest unmet needs across the innovation process.
The front end of the innovation process is where things break down first
What’s as significant is what doesn’t appear at the top of the ranking. Execution, development, and launch (the activities organizations invest most heavily in improving) are not where the pain is. Organizations are generally capable of building and shipping. The challenge is ensuring they’re building and shipping the right things to the right people.
When products fail, execution tends to get the blame. A missed launch, a feature that didn’t land, a competitive move that caught the team off guard. But the failure almost always traces back further. The wrong market was chosen. The wrong customers were targeted. The wrong problem was defined. Execution teams don’t create these problems. They inherit them from decisions made before they were ever involved.
Fixing execution without fixing the front end is treating the symptom. The organizations that consistently produce successful products invest in making better early decisions, not faster later ones.
Finding 02
IMPORTANCE VS. SATISFACTION
72% / 14%
Largest importance-satisfaction gap in the entire dataset. Step one of the innovation process.
Market selection is the highest-leverage decision in innovation, and the most underserved
Most leaders who’ve wrestled with this decision know the feeling. You need to assess whether a market is worth pursuing. So you do what most teams do: you size it. TAM, SAM, and SOM figures get assembled. Category spend gets estimated. Analyst reports get purchased. Weeks of work produce numbers that look authoritative. The confidence still isn’t quite there.
That feeling isn’t a failure of effort. It’s a structural problem with the inputs. Market sizing based on category spend and geography rests on assumptions that compound. And when a market is defined around a product category, the boundaries of that product become the boundaries of the visible opportunity. Adjacent demand stays invisible. Teams optimize for the customers they already have, the competitors they can already see, and the needs the current offering already addresses. When a new entrant eventually captures demand that was always there, the question is always the same: how did we miss that?
A market defined around a Job-to-be-Done looks different. It starts not with the product but with the people using it and the outcome they’re trying to achieve.
Most leaders who struggle to assess market attractiveness aren’t lacking data. They’re asking the right questions about the wrong definition of a market.
Finding 03
IMPORTANCE VS. SATISFACTION
71% / 15%
Four of the six highest-priority decisions in the dataset share a single root cause: organizations haven’t aligned on what a customer need actually is.
Customer needs are the goal of innovation, and the most misunderstood
Four of the six highest-priority decisions in the dataset share a single root cause. Organizations don’t know precisely what their customers need. Not approximately. Not directionally. Precisely. 71% of innovation leaders rated understanding customer needs as very or extremely important. Only 15% said they do it well.
This isn’t a research effort problem. Most organizations are running customer research — interviews, surveys, feature requests, support reviews. The activity is happening. What the data reveals is something more fundamental: organizations haven’t aligned on what a customer need actually is. Without that alignment, everyone is capturing something different and calling it the same thing.
Three compounding failures follow. Most organizations don’t have a comprehensive set of customer needs — the boundaries of what they’re capturing are shaped by the current product, not by the full scope of what customers are trying to get done. They don’t have alignment on the needs they do have, so product, marketing, and strategy each work from their own version of the picture. The third failure is where the first two converge: they don’t know which needs are unmet, or why, which means they can’t reliably distinguish an opportunity worth backing from one that only looks like one.
The sequence matters. You can’t prioritize what you haven’t found. And you can’t find the complete set until everyone understands the same thing when they write a need down.
Example: Microsoft
Finding 04
IMPORTANCE VS. SATISFACTION
69% / 13%
Lowest satisfaction score in the entire dataset. Demographic segments create what look like real targets. They don’t behave like them.
Most organizations segment on who customers are, not what they’re struggling to get done
They don’t.
Customers don’t cluster around needs based on who they are. They cluster around needs based on what they’re struggling to accomplish. Two customers in the same industry, at the same company size, in the same geography, can have entirely different unmet needs. Two customers who look nothing alike demographically can share the same core struggles and respond identically to the same solution. Demographic segments create what look like real targets. They don’t behave like them.
The data reflects this. The ability to identify which customer segments to target produced the lowest satisfaction score in the entire dataset. 69% of innovation leaders rated it as very or extremely important. Only 13% said they do it well.
The consequences reach across the product, the messaging, and the resource allocation. Products get designed for a blended average of needs across a demographic group rather than a precise set of unmet ones. Messaging describes customers in ways that don’t resonate. Budget gets distributed according to a structure that doesn’t reflect where the real opportunity lives.
Example – Motorola
The segments were always there. The previous segmentation approach couldn’t see them.
All four findings point to the same conclusion
The four findings aren’t independent. They compound.
Selecting the right market determines where you compete. Understanding customer needs precisely determines what’s at stake within that market. Segmenting by unmet need rather than demographics determines which customers represent the greatest opportunity. All three depend on front-end decisions being made with discipline rather than instinct or the preferences of whoever is arguing loudest.
The organizations that consistently produce successful products aren’t more creative or better resourced than those that don’t. They make better decisions earlier. They treat those decisions as what they are: the most consequential calls in the innovation process, not administrative work that happens before the real work begins.
By the time a failed product ships, the decision that doomed it was already made. The question is whether you knew which decision that was, and whether you had a way to make it better.
Turning innovation from an art into a science starts with a diagnosis
Across more than thirty years and hundreds of engagements, Strategyn’s ODI clients have achieved an 86% innovation success rate, compared to the 5–20% industry average. That gap isn’t the result of better execution. It’s the result of better decisions made earlier.
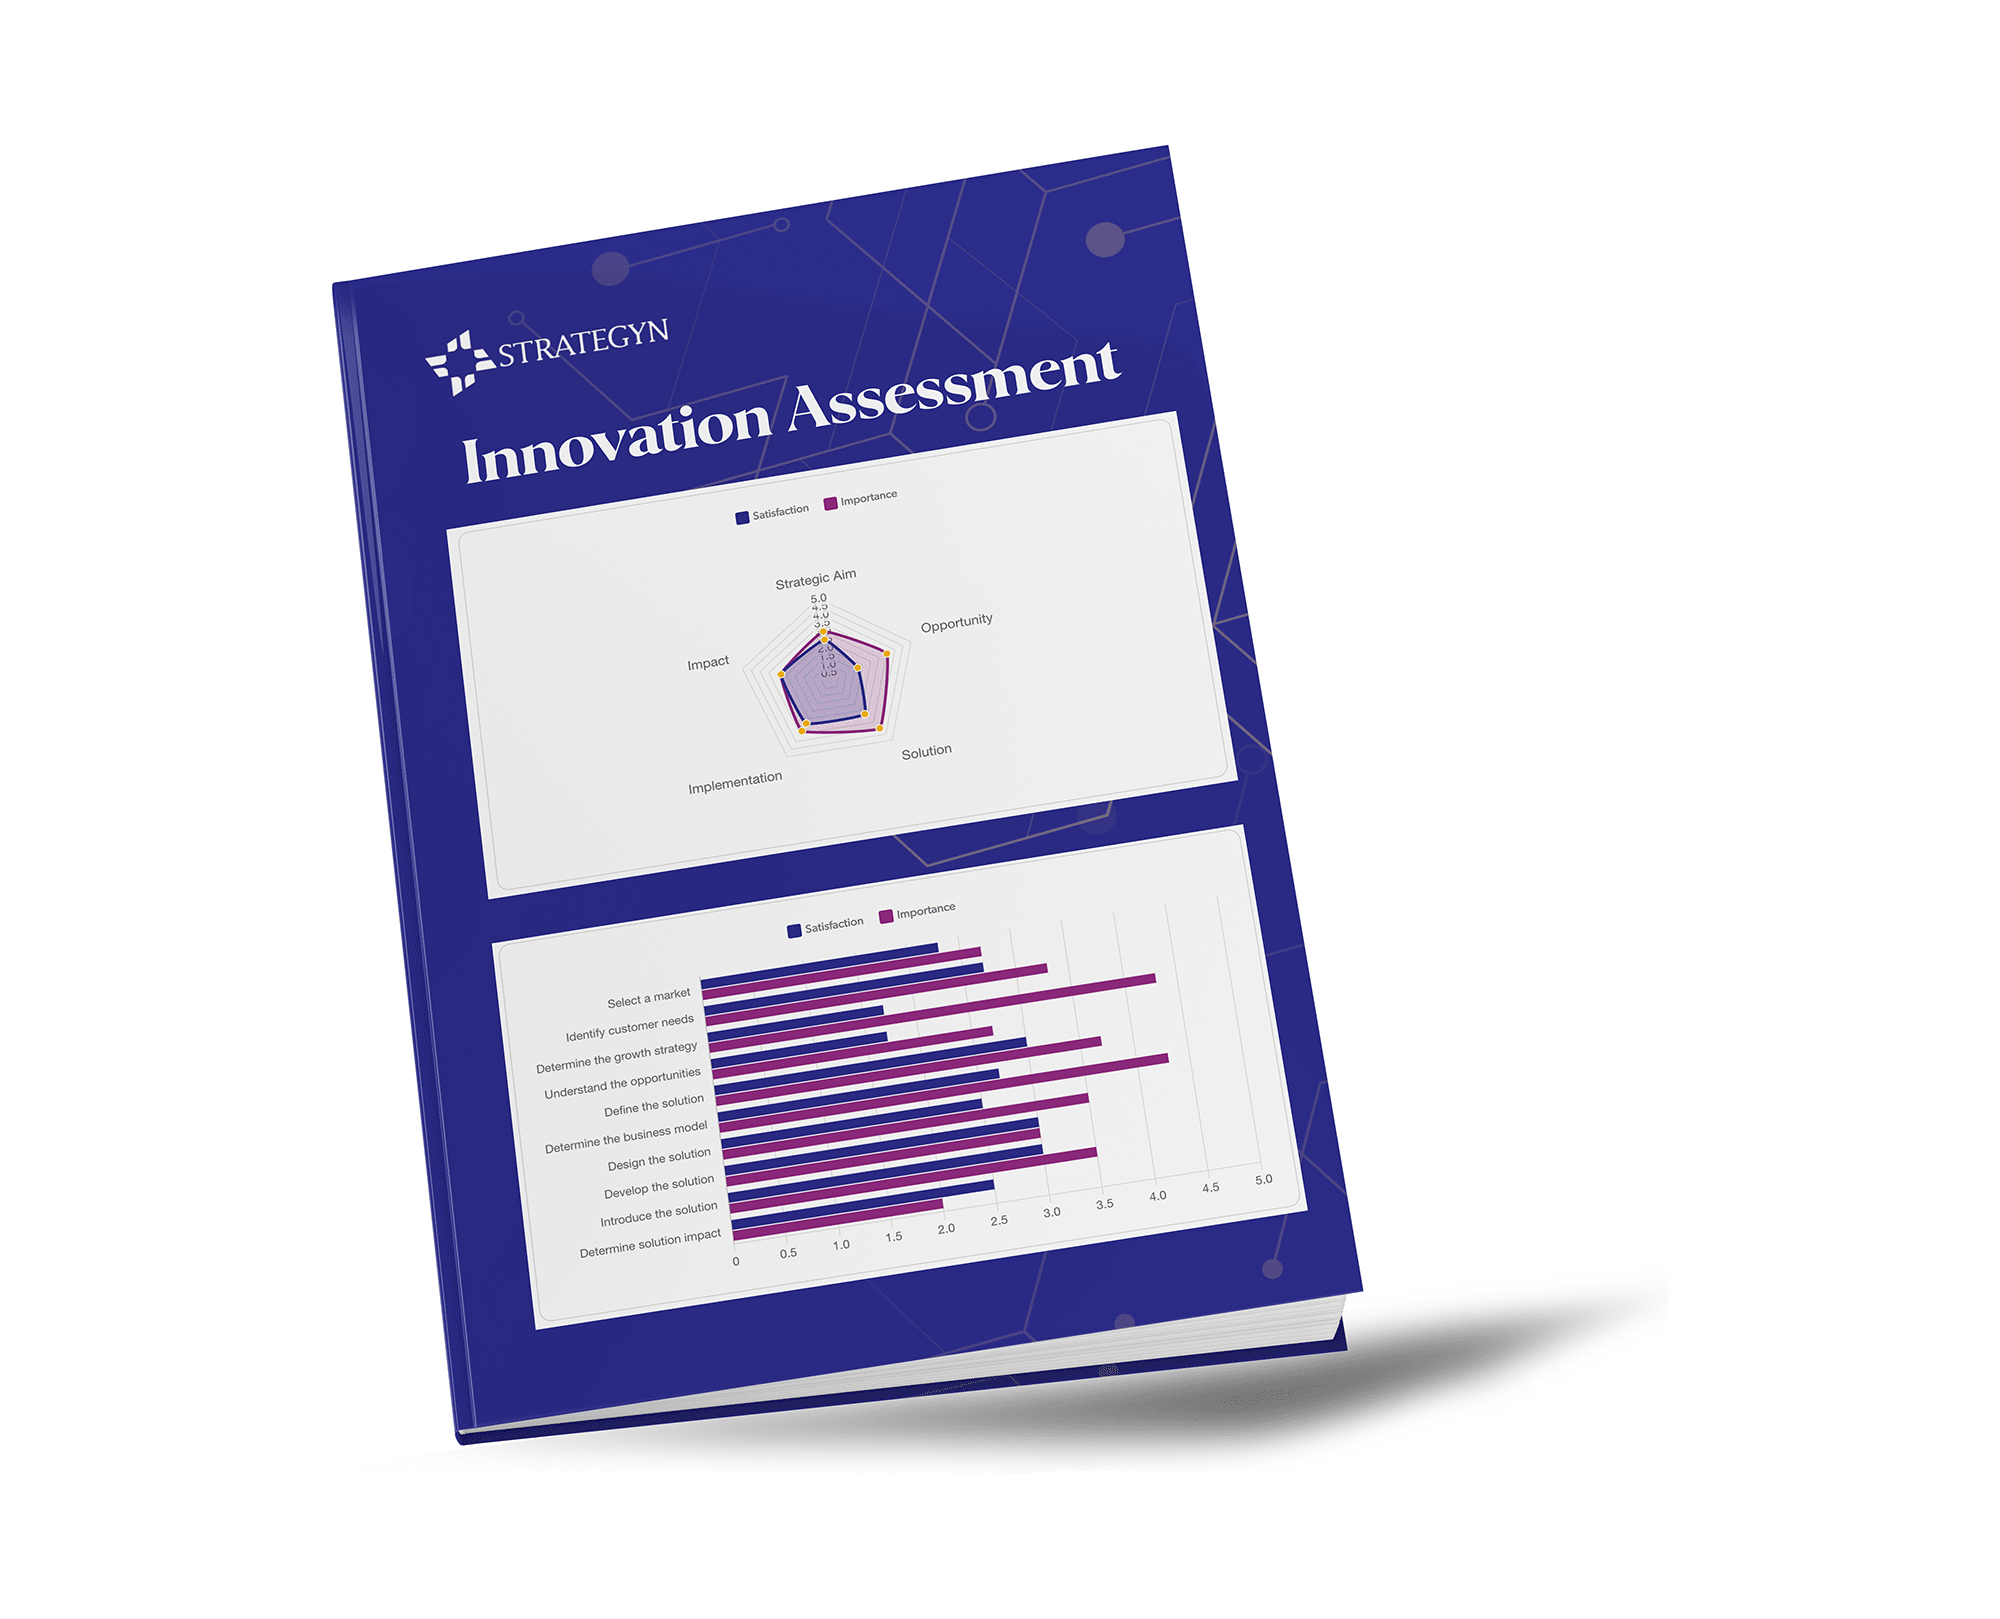
The Innovation Assessment is the entry point. It evaluates how your organization makes the 26 decisions that most determine whether new products and growth initiatives succeed, surfaces which decisions are costing you most, and shows you where to focus first.
It takes 10 minutes. It’s free.
86%
Innovation success rate
VS
5-20%
Industry Average

A note from Tony
Innovation will always involve uncertainty. The question is whether that uncertainty is managed with discipline or left to chance.
The organizations that consistently produce successful products aren’t the ones with the most creative teams or the biggest R&D budgets. They’re the ones that have figured out how to make the right calls before the expensive work begins. They treat innovation not as an art to be inspired by, but as a discipline to be practiced.
I’ve watched this shift happen for more than thirty years. The organizations that succeeded didn’t wait until something broke. They started before they thought they needed to.
— Tony Ulwick — Founder, Strategyn