Innovation is transformed from an art to a science when you have the ability to quantify your customer’s unmet needs.
I first began working on the problem of how to define, measure, and prioritize customer needs in the Spring of 2004 when I started working with a new-business ventures unit at HP. But it wasn’t until I read Tony Ulwick’s manuscript for What Customers Want that I realized it was possible to treat the management of innovation as a science. His ideas fundamentally transformed my career, and I am forever grateful to Tony and others who have embraced my questions and enabled me to grow and now contribute to the innovation community that has given me so much.
In the course of my work and travels, I often answer questions about how we at Strategyn quantify and prioritize customer needs. Clients, practitioners and those seeking to advance the growing scholarship of innovation ask questions to uncover truths, push boundaries, and satisfy their doubts.
One question I get quite frequently relates to our Opportunity Algorithm, a formula we use as part of the Outcome-Driven Innovation process to quantify, prioritize and target unmet customer needs (desired outcomes).
People ask, “What is the magic behind the algorithm? How do you use it to quantify and prioritize desired outcomes in a way that is both accurate and statistically valid?”
By way of analogy, we use an opportunity algorithm to compute a score similar to a credit score in finance. In finance, lenders assign a number to a person that indicates their capacity to repay a loan. They compute a person’s credit score (and thus determine their credit worthiness) based on some inputs: income, debt, payment history, gender, and age, among others. They measure these data in different units — income and debt in dollars, payment history as a frequency of missed payments, gender as an unordered binary attribute, and age as an ordinal, interval variable in years. With these different measures, financiers have learned that those with higher income and lower debt, few or no missed payments, women more than men, and those who are more mature in years tend to be more credit worthy. Careful measurement, the use of statistics, and the development of algorithms have enabled lenders to progress from the dark ages of “guessing” a person’s credit worthiness.
Similarly, we use an opportunity algorithm to quantify which of the customer’s desired outcomes are unmet, and to what degree. A desired outcome statement is a uniquely defined need statement that describes how customers measure success when getting a job done. We assign a number to a desired outcome that indicates whether products or services used in a given market adequately or inadequately serve it.
In lay terms, we say a desired outcome represents an opportunity for innovation when (1) it is underserved — the outcome is important to customers, but not well satisfied given the products and services currently available to them, and also when it is (2) overserved — the outcome is well satisfied, but it is not important to customers. When an outcome is underserved, it is a target for value creation. When an outcome is overserved, it is a target for cost reduction.
We operationalize this thinking by asking respondents to rate desired outcome statements (which are devoid of solutions) for importance and satisfaction using ordinal, categorical scales. We then compute importance and satisfaction scores based on top-two-box proportions. Consistent with the proper and valid use of statistics on ordinal data, we do not assume the distance between scale points. Nor do we use the scale points themselves as inputs to computation. Instead, we compute top-two-box proportions, a widely-used and statically valid way of analyzing ordinal data.
Like all proportions, importance and satisfaction scores are themselves dimensionless. We then take these two proportions, represented as scores, as inputs into the Opportunity Algorithm:
Opportunity = Importance + (Importance — Satisfaction)
In this algorithm, “importance” is the percentage of people rating the outcome very or extremely important and “satisfaction” is the percentage of people rating the outcome very or extremely satisfied.
The algorithm embodies a fundamental philosophy: desired outcomes that are both highly important and poorly satisfied represent opportunities for value creation.
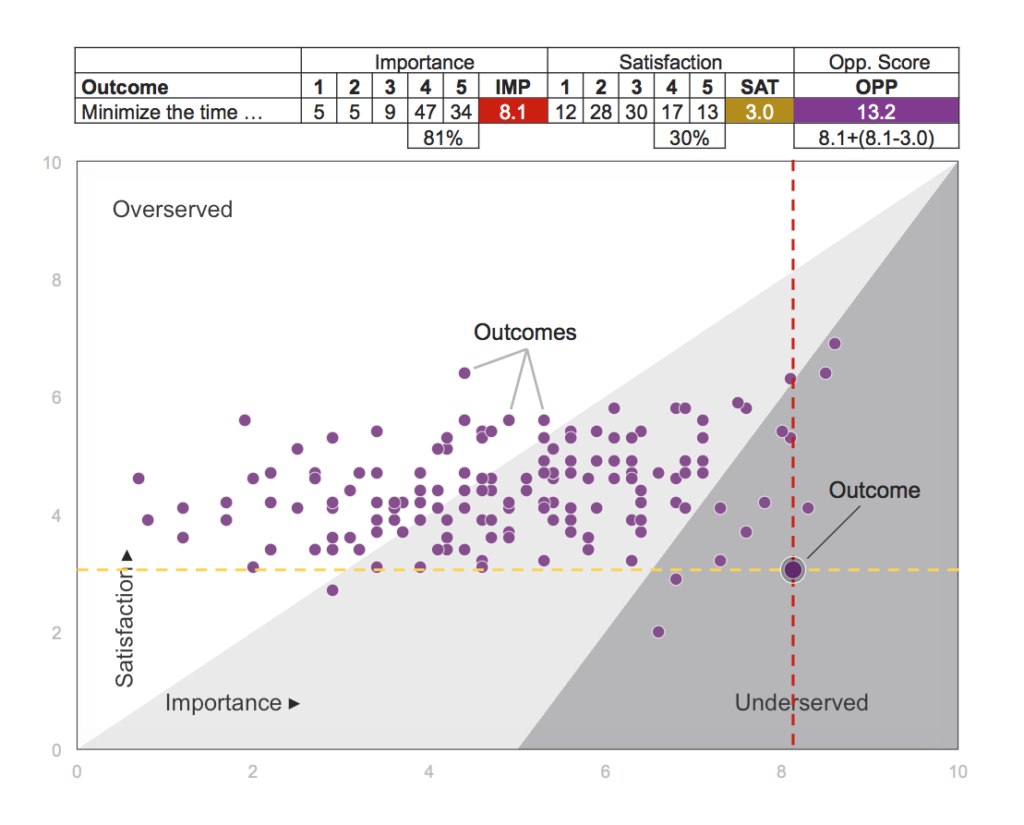
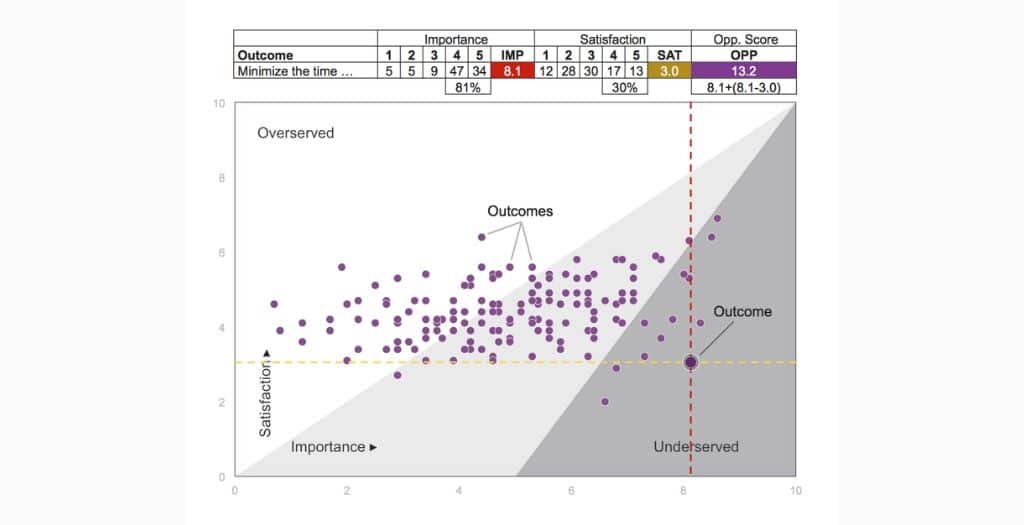
If 81% of surgeons, for example, rate an outcome very or extremely important, yet only 30% percent rate it very or extremely satisfied, that outcome would be considered underserved. In contrast, if only 30% of those surveyed rate an outcome very or extremely important and 81% rate it very or extremely satisfied, that outcome would be considered overserved.
Plotting the opportunities on the Opportunity Landscape (shown below) enables us to quickly see which of the 100-plus outcomes are under and over-served in a market — and to what degree.

The opportunity algorithm is built on the following assumptions:
1. Desired outcomes are measures of customer success with which we can judge ideas, criticize them, and thereby improve them.
2. Needs and solutions are distinct, as are desired outcomes and solution preferences.
3. Needs that are of higher importance and lower satisfaction are better targets for value creation than those that are of lesser importance and greater satisfaction.
4. Needs that are of lower importance and higher satisfaction are better targets for cost reduction than those that are of greater importance and lesser satisfaction.
We have been methodical, systematic, and careful in developing a method that we have found in practice over the past 25 years to be reliable and repeatable in helping innovators to reduce the risks inherent with innovation. We have validated it both in practice (86% success rate) and with PhDs in marketing, statistics, and engineering.
Measurement and quantification of the unseen — especially of customers’ mental processes — isn’t perfect, and yet is it critical to advancing progress. In our experience, the lack of application of scientific principles in management science, marketing, and innovation has stalled its progress relative to other fields that have adopted and embraced it.
Opportunity Algorithm in Identifying Unmet Customer Needs
The invaluable opportunity algorithm visualizes to what degree the markets are under and over-served and offer business growth no market research has ever delivered. It achieves the goal in several ways:
Map Customer Journey
To discover unmet customer needs and grab new market opportunities, businesses must map the customer journey and spot the blockage. The proper intervention must be drafted to offer a solution capable of increasing loyal customers.
Use Existing Customer Data
Using existing customer data to identify unmet customer needs helps identify customer pain points by checking data from common support drivers. For instance, what do your customers hate doing? What annoys them? What drives their decision? How does change fit into their lives, and what are the barriers and fears surrounding the change? In other words, use the customer’s journey to identify their needs instead of relying on industry trends.
Listening to Voice-of-Customer
What better way to understand what job customers require your product or service do if not from the horse’s mouth? Voice of customers offers real-time insights and opinions and provides an excellent platform to augment existing services for optimum customer satisfaction.
Perform Competitive Analysis
The competitive analysis gives you broad insight into your competitor’s products, sales, and marketing and helps you stay relevant to your target audience. Knowing which need a competitor’s product or service is meeting enables businesses to gauge whether or not a product they intend to develop will get the same job done.
I welcome your questions. Together, let’s continue the dialog and advance progress in innovation.


